
Solar
Reading Your Solar Monitoring App Like a Pro
Generation, consumption, export, self-use — your monitoring app tells a story. Learn the four numbers worth watching each week.
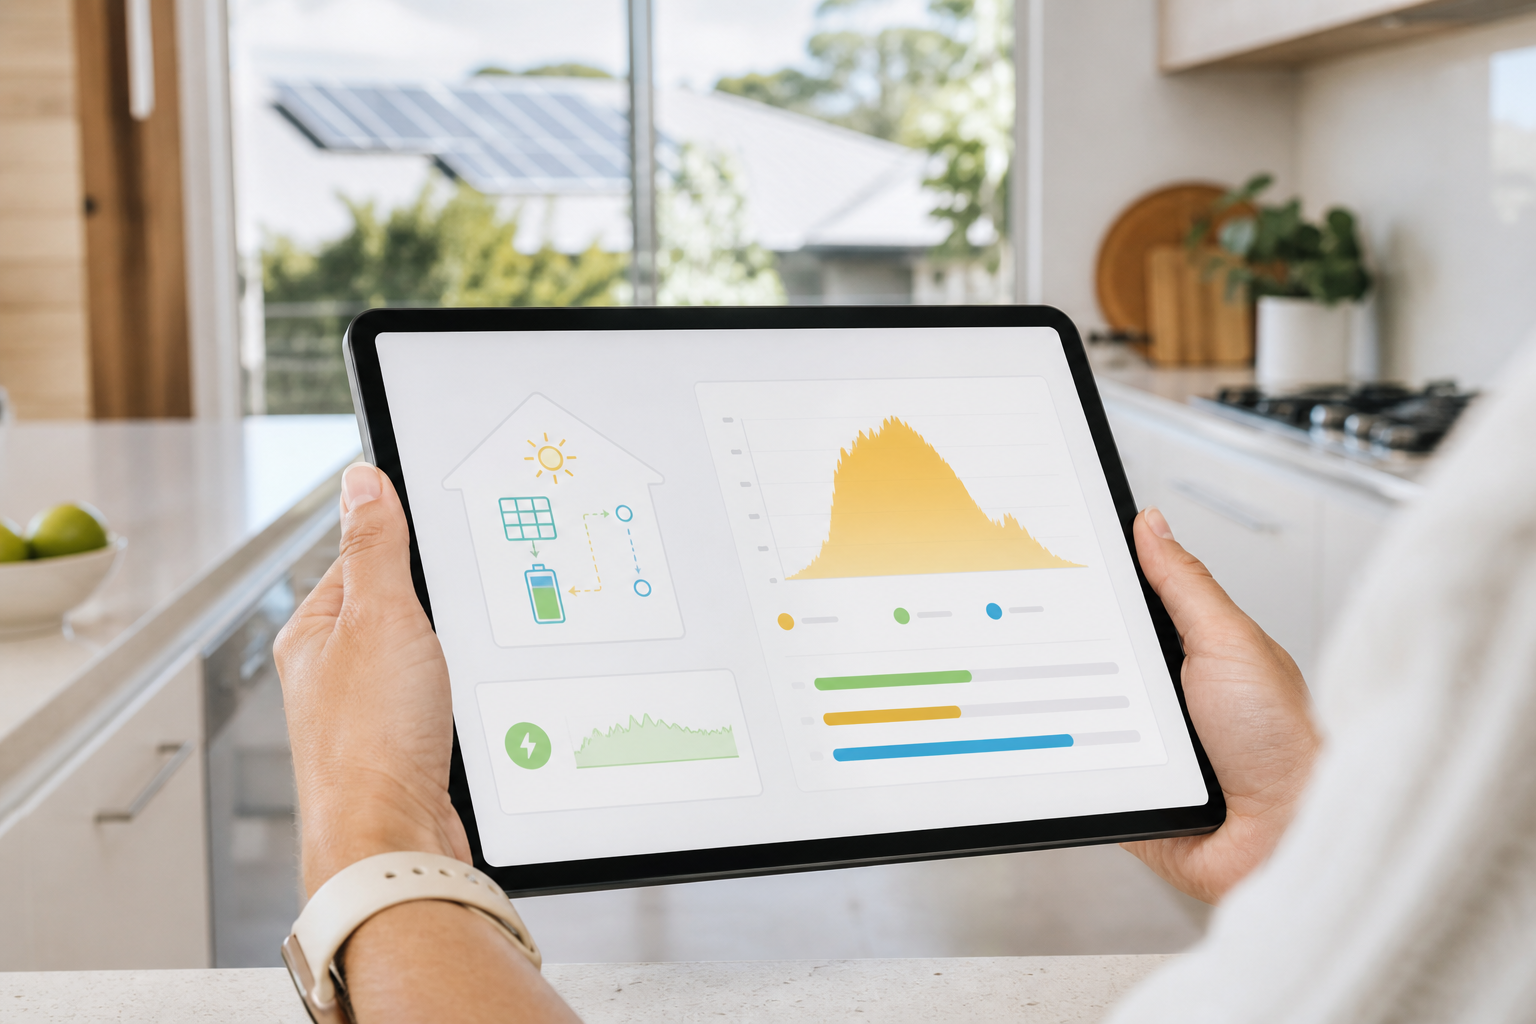
Every system we install comes with a monitoring app, and yet most owners open it twice — once on install day, and once when a bill arrives. That's a missed opportunity, because the app is the single best tool for making sure your investment keeps performing. Here are the four numbers that matter and what they should look like.
1. Daily generation
This is the headline figure: how many kilowatt-hours your panels produced today. Expect it to swing with the seasons — a 6.6 kW system in Melbourne might peak above 35 kWh on a clear January day and dip under 10 kWh in mid-winter gloom. The number to watch is not any single day but the trend: if your clear-sky days this summer are noticeably lower than last summer, something deserves a look — soiling, shading from grown trees, or a string fault.
2. Self-consumption
Self-consumption is the share of your solar you actually use rather than export, and it is the most valuable electricity you own. Every kilowatt-hour you self-consume replaces grid power at 25 to 35 cents; every one you export earns only a few cents in feed-in tariff. Shifting dishwashers, washing machines and pool pumps into daylight hours can lift self-consumption dramatically with zero hardware cost.
3. Export patterns
A consistently huge export figure sounds like winning, but it usually means your system is generating far more than the household absorbs. That's the classic signal that a battery would earn its keep — instead of selling cheap at noon and buying dear at 7pm, you store the surplus and use it yourself.
4. The flatline check
The most important habit is the simplest: glance weekly for flatlines. An inverter that has tripped or a failed connection can sit silently at zero for weeks while you pay full grid prices. Most apps let you enable alerts — turn them on. It takes thirty seconds and protects years of savings.
When the numbers look wrong
Panels lose a little output as they age — around half a percent a year is normal, so a ten-year-old system producing 95 percent of its original figures is behaving exactly as designed. Anything sharper than that usually has a fixable cause: accumulated dirt after a dry spell, leaf debris caught along the bottom row, a shading change from a tree that has grown since installation, or an electrical issue on one string. Grid2Solar customers can send us a screenshot of the app and we'll interpret it for free, or book a service visit if the data points to a genuine fault. The app is your early-warning system; check it weekly and small issues stay small.